
Stocks? Pt. 3
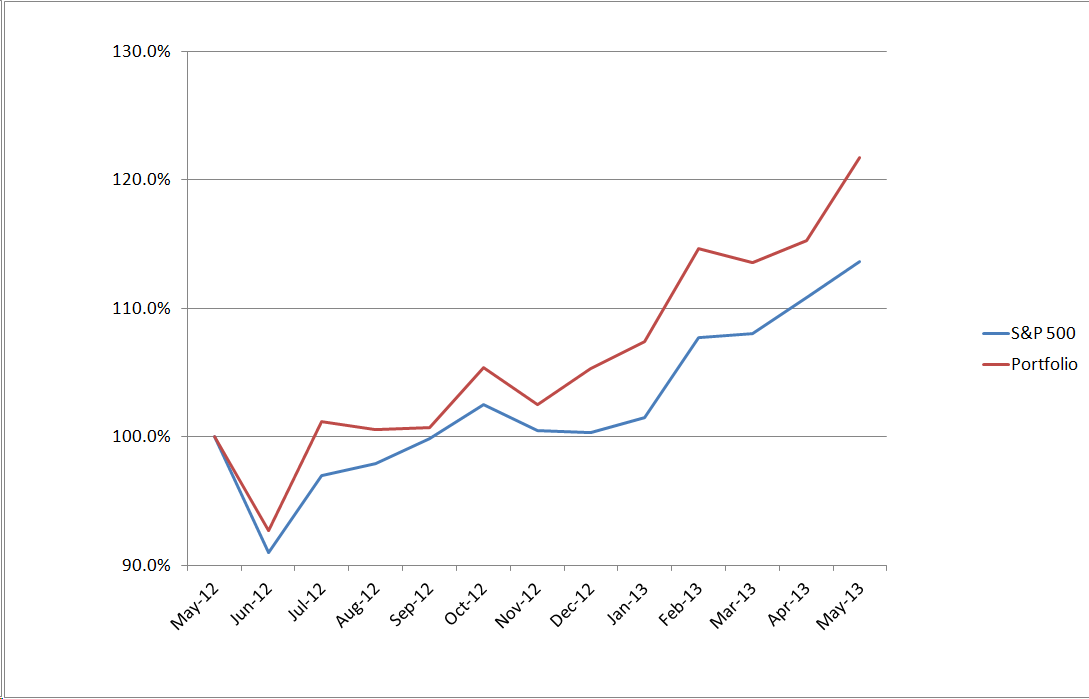
Through the first six months of the year, the S&P 500 is up from 1462 to 1606 (9.8%), while the Morningstar value portfolio is up 6.6%.
Applied Materials (+28%), Berkshire Hathaway (+23%), Microsoft (+26%), and Western Union (+23%) stood out as winners, but the portfolio had double-digit losers in Weight Watchers (-14%) and CH Robinson (-12%) as well. As before, many companies in the portfolio remain good values, but simply are not among the more popular or trendy stocks currently.
Although the portfolio may remain a quality long-term investment short-term performance has been mixed so far.
One Year Portfolio Checkup, May 1, 2013
S&P 500: 1597 (113.6%)
Portfolio: $608,800 (121.7%)
IBB 1253 shares $215,903
ITB 8160 shares $197,961
IYT 1585 shares $174,396
Cash $20,582
Notes: The portfolio has outperformed the S&P 500 over the past calendar year by 8.1%, and would have finished an additional 3% ahead of the S&P 500 if not out of the market due to a settlement/trading problem during a brief period last July.
Portfolio, April 3, 2013
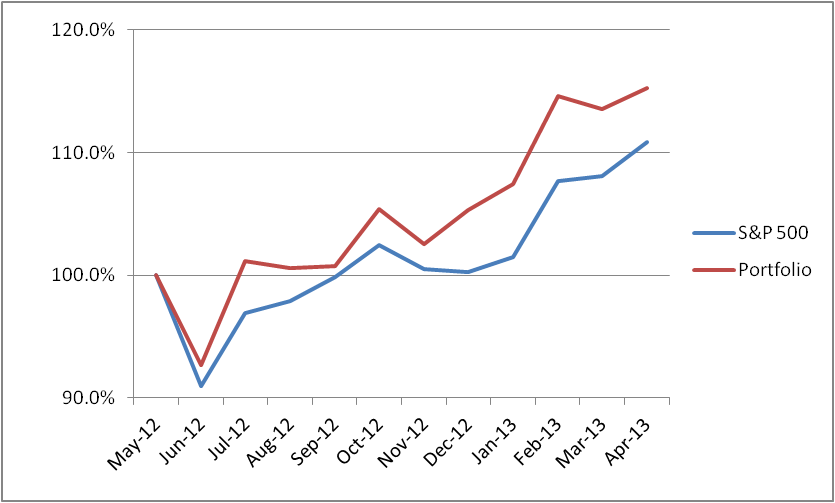
S&P 500: 1557 (110.8%)
Portfolio: $576,323 (115.3%)
IBB 1253 shares $200,166
ITB 8160 shares $183,110
IYT 1785 shares $190,959
Cash $582
Notes: The portfolio sold XLP, the consumer staples ETF that was bought last month as a defensive position, and bought IBB, a biotech ETF that has been performing well. XLP’s modest gains helped mitigate some losses incurred, as housing (ITB) is down slightly on the month.
Our portfolio is up 15.3 percent since May 1, 2012 compared with 10.8% for the S&P500. The portfolio briefly reached gains of 20% mid-month, while the S&P 500 reached a mid-month high of 1570, for a 11.7% gain since May 1, 2012.
Stocks? Pt. 2
As it turns out, buying the “unloved” stock examples Blackberry and Netflix would have dramatically outperformed the Morningstar stock portfolio of 20 undervalued stocks through the first quarter, as the portfolio returned only 1.4%. Note the S&P 500 was up 7.4%, and our unloved examples of BBRY and NFLX (very risky/volatile) would have been up 60%.
Although the Morningstar value portfolio did well with a few picks such as Berkshire Hathaway and Excelon (+15%), it also had poor picks like Weight Watchers (-23%) that weighed down the portfolio. The performance difference between the hand-picked stock examples and Morningstar’s portfolio of undervalued wide-moat stocks is largely due to earnings and product announcements from BBRY and NFLX, as well as somewhat broader interest in these names than in most companies in the Morningstar portfolio.
Many of the Morningstar portfolio stocks remind me of another holding I have – China Gueri (CHOP), a Chinese specialty metal producer that is tremendously overvalued but isn’t on many people’s radar. The price of a stock is based both on the free cash flow of the underlying company and on market sentiment, and it seems market sentiment may change with less-known stocks relatively slowly.
I’m not inclined to rebalance the Morningstar portfolio given the few changes and poor performance through the first quarter, but will revisit its performance in coming quarters.
Trade, March 4, 2013
Today the portfolio sold its stake in XBI, the Biotech ETF, and in XLE, the Energy ETF. It bought 1785 shares of IYT, a Transportation ETF, and 4990 shares of XLP, a Consumer Staples ETF. The portfolio now holds $952 in cash.
Portfolio, March 2, 2013
S&P 500: 1518 (108.0%)
Portfolio: $567,615 (113.5%)
XBI 2010 shares $191,010
ITB 8160 shares $184,497
XLE 2460 shares $119,363
Cash $744
Notes: The portfolio is up 13.5 percent since May 1, 2012 compared with 8% for the S&P500. Note the portfolio lost an additional 3% relative to the market during July, when it was out of the market for a couple days while changing positions.
Stocks?
So far, the fund has bought mutual funds and ETFs, but no stocks. This is in part to minimize transaction costs and management complexity, and to benefit from the relative diversity offered by holding low numbers of mutual funds relative to low numbers of stocks.
While it’s tempting to buy unloved stocks such as Netflix or Blackberry hoping they’ll break out, or buy Apple based on its historic market leadership and low price/earnings ratio, building a stock portfolio can be perilous. Many investors buy “hot” stocks once they’ve become hot, often capturing the common fall back to Earth rather than further price appreciation. Investors who do not research stocks full-time also often hold too few stocks to build a portfolio having tolerable volatility, and tend to not dedicate the weekly time needed to follow each stock (much less to scout for potential new purchases).
I’ve recently started tracking a stock portfolio based on long-term performance of undervalued stocks selected by formula, proposed by Morningstar and said to return 17% on average. The new stock portfolio tracks 20 stocks Morningstar estimates to have the best price/fair value estimate, and that have a “wide moat”, or significant barrier to competition. The portfolio started the year with $500,000, equally distributed among the following stocks, and will re-evaluate quarterly:
AMGN AMZN AMAT BK BRK-B CHRW CMP EXC EXPD ESRX FB GD INTC JW-A MLM MSFT NOV POT WTW WU
Trade, February 6, 2013
Today the portfolio sold its stake in DGS, the Wisdom Tree Emerging Small Cap Dividends ETF, and bought 2460 shares of XLE, the S&P Energy Select ETF for an average of $77.88 per share. The portfolio now holds $744 in cash.
Portfolio, February 2, 2013
S&P 500: 1513 (107.7%)
Portfolio: $573,092 (114.6%)
XBI 2010 shares $193,060
ITB 8160 shares $188,740
DGS 3790 shares $191,281
Cash $10
Notes: The portfolio is up 14.6% since May 1 2012, compared with 7.7% for the S&P500. Will we get eight more weeks of strong net asset value growth if the groundhog sees his shadow?
Portfolio, January 1, 2013
S&P 500: 1426 (101.5%)
Portfolio: $537,077 (107.4%)
XBI 2010 shares $176,638
ITB 8160 shares $172,747
DGS 3790 shares $187,680
Cash $10
Notes: The portfolio is up 7.4 percent since May 1, compared with 1.5% for the S&P500. Note the portfolio lost an additional 3% relative to the market during July, when it was out of the market for a couple days while changing positions.
