
Portfolio, Arpil 1, 2014
S&P 500: 1885 (134.2%)
Portfolio: $778,100 (155.6%)
IBB 1153 shares $278,622
VHT 2025 shares $218,214
PGJ 7750 shares $240,560
Cash $40,704
Notes: The portfolio has not made any changes this month. China (PGJ) and biotech (IBB) holdings suffered in market that is becoming skittish, losing some of this year’s gains:
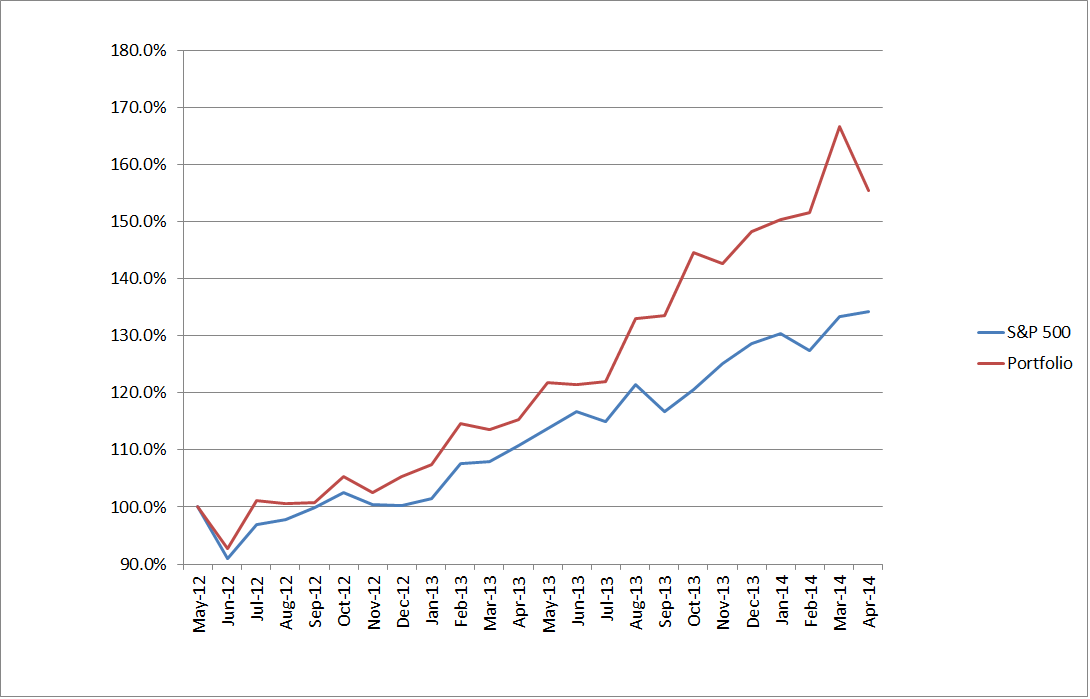
Portfolio, March 4, 2014
S&P 500: 1874 (133.4%)
Portfolio: $833,223 (166.6%)
IBB 1153 shares $310,041
VHT 2025 shares $223,659
PGJ 7750 shares $259,005
Cash $40,704
Notes: The portfolio has not made any changes this month, and has outperformed the S&P 500 by approximately double since beginning this blog. The S&P 500 strongly recovered from a minor correction in February, but the portfolio was positioned in three of the best-performing sectors of February and outperformed the S&P 500:

A More Diversified Portfiolio
The model portfolio tracked in this blog is quite aggressive, seeking to hold 3-5 sector funds that give the portfolio the best chance for growth in coming months. Although the holdings in the model portfolio are desirably not strongly correlated with one another, they lack the diversity of a traditional portfolio. A monthly chart plotting movement of the model portfolio relative to the S&P 500 is therefore also typically provided, graphically illustrating efforts to keep the portfolio’s volatility reasonable relative to the S&P 500.
Although model portfolio volatility has been modest over the past several years given the increased performance realized, many investors have a longer time horizon for investment, and seek more diversified investments that can be held for longer periods (such as a year) between portfolio reviews. A diversified portfolio (not including bonds, which may constitute up to 30% of such a portfolio for retirees or those wishing to further minimize volatility) is therefore provided here as a reference, such that it can be reviewed and compared against this blog’s more aggressive model portfolio.
The diversified portfolio (Feb 1, 2014) includes:
Ticker Value Shares
ARTJX $100,000 3776.4 Artisan International Small Cap
DODGX $300,000 1836.9 Dodge and Cox Stock
OAKIX $200,000 7874.0 Oakmark International
PRSVX $200,000 4133.9 T Rowe Price Small Cal Value
VASVX $200,000 7352.9 Vanguard Select Value
Although the fund appears on its face that it may be biased toward international (30%) and value (40%) stocks, use of a portfolio analyzer tool such as Morningstar’s professional portfolio manager indicates the this combination of funds is 57% large cap, 24% mid-cap, and 18% small-cap, with 33% value, 36% core, and 32% growth stocks. The diversified fund is 62% North American and 22% European, with only 2.25% in riskier Asia emerging markets and .5% in Latin America. There is nearly no stock overlap between funds, with DODGX and VASVX both holding Capital One Financial (COF) at 1.6% total the only significant duplicate.
A diversified fund such as this is suitable for most passive investors with a long-term time horizon, and can be supplemented with a bond fund (such as PTTAX – Pimco Total Return) in an amount up to 25% or so for those wishing to further reduce volatility (note that increasing bonds beyond about 30% or so in such a portfolio has been shown to reduce portfolio returns without meaningful reduction in volatility).
Portfolio, February 7, 2014
S&P 500: 1789 (127.3%)
Portfolio: $757,509 (151.5%)
IBB 1153 shares $281,435
VHT 2025 shares $208,312
PGJ 7750 shares $226,920
Cash $40,704
Notes: The portfolio sold IAI, the brokerage ETF, and bought VHT, the Vanguard Health Care ETF. Although the market in general was down for the year through February 7, the portfolio of growth sector mutual funds did not suffer the same fate:

Portfolio, January 10, 2014 (featuring a trade!)
S&P 500: 1842 (131.1%)
Portfolio: $771,287 (154.3%)
IBB 1153 shares $274,356
FSAVX sold
IAI 5675 shares $219,004
PGJ 7750 shares $237,522
Cash $40,405
Notes: The portfolio has made its first trade in months, as FSAVX has not performed as well as top funds/ETFs in recent months. The portfolio has done well even since the January 2 update, in large part due to its biotech stake.
Stocks? Pt. 4
Through the last year, the S&P 500 is up from 1462 to 1832 (25.3%), while the Morningstar value portfolio is up 21.2%.
Of the stocks in the original portfolio, Facebook nearly doubled (99%), Amazon was up by 55%, and Applied Materials was up 50%. Other significant gainers included Microsoft, John Wiley General Dynamics, Amgen, and Bank of New York. Unfortunately, Potash lost 21%, and Weight Watchers lost 40% over the same period.
The portfolio as a whole slightly underperformed the S&P 500 in a relative bull market, suggesting that blindly purchasing a portfolio of stocks meeting Morningstar’s value criteria may not be an optimal investment strategy, at least in the bull market of the past year.
Portfolio, January 1, 2014
S&P 500: 1832 (130.36%)
Portfolio: $751,762 (150.3%)
IBB 1153 shares $261,823
FSAVX 3820 shares $212,850
PGJ 7750 shares $236,607
Cash $40,480
Notes: The portfolio has not made any changes since the October 1 update, and has outperformed the S&P 500 by 66% since beginning this blog. The portfolio lagged the S&P 500 in October, but outperformed in November and December, as reflected in the chart below:

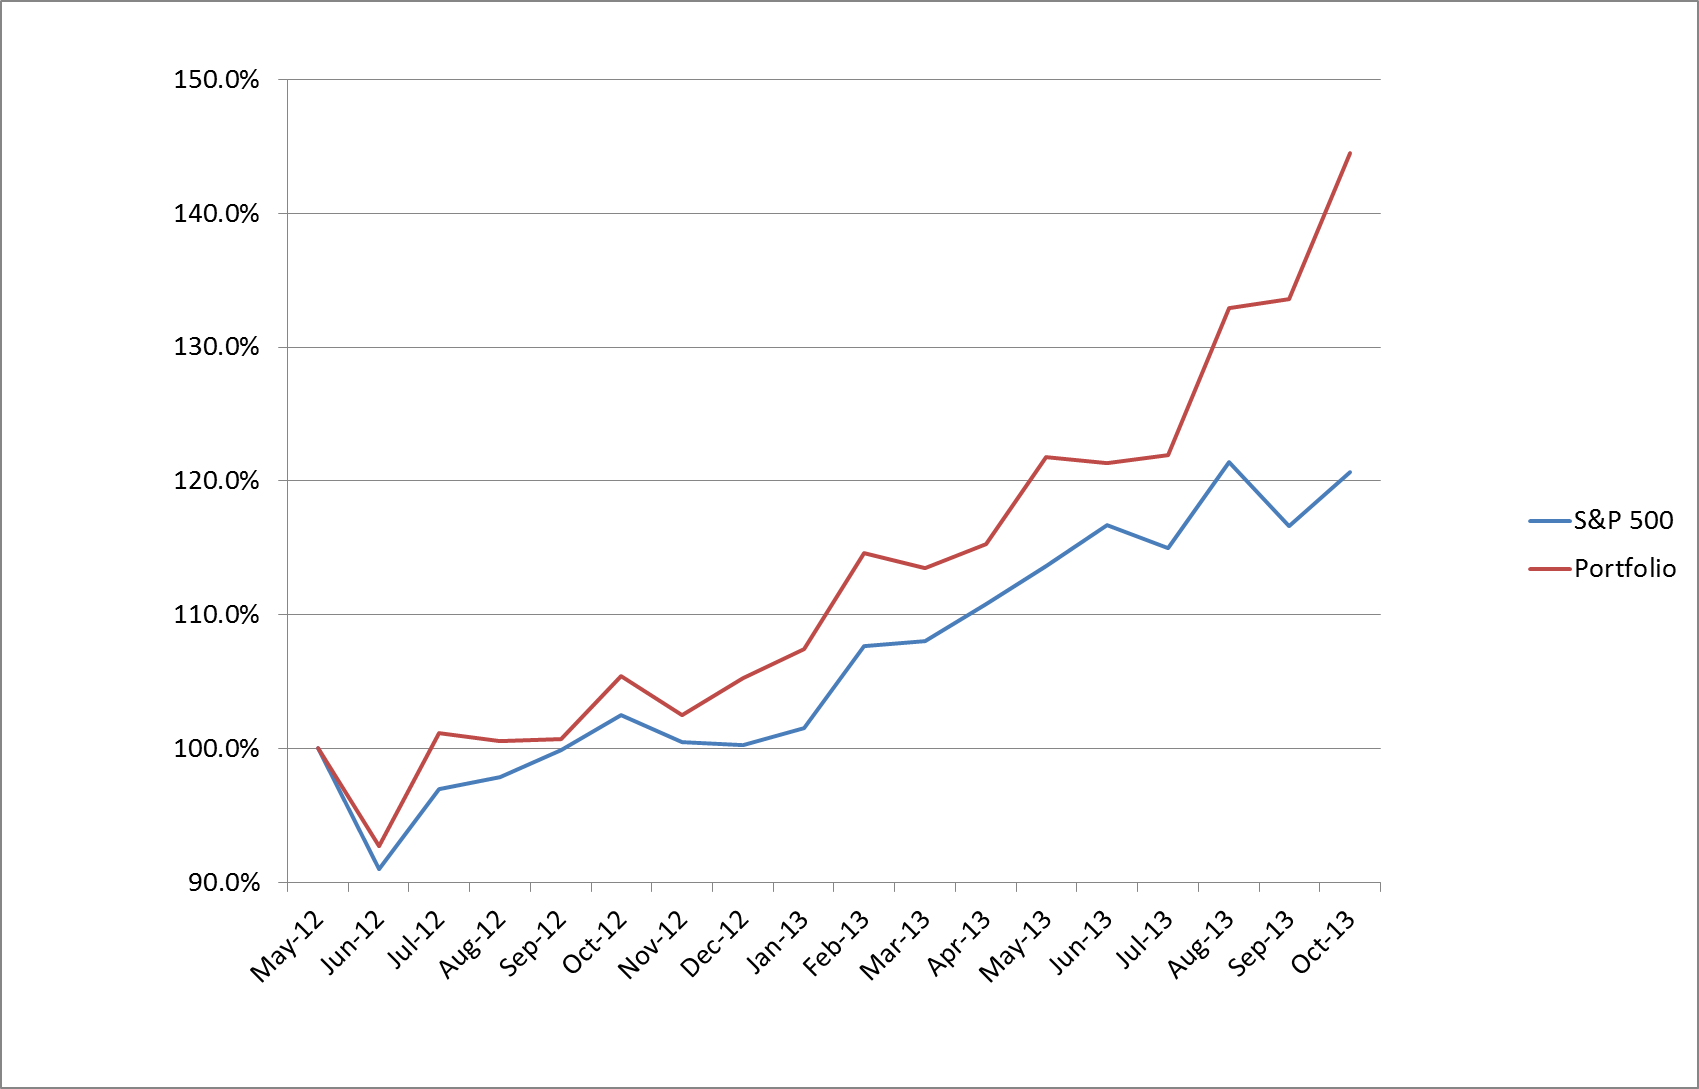
Portfolio, October 1, 2013
S&P 500: 1695 (120.6%)
Portfolio: $722,613,601 (144.5%)
IBB 1153 shares $246,488
FSAVX 3820 shares $208,648
PGJ 7750 shares $226,997
Cash $40,480
Notes: The portfolio still holds IBB (Biotech), but now holds PGJ (China) and FSAVX (autos).
Trades
The portfolio sold its position in IYZ (Telecom) on Monday, July 8, and bought the Fidelity Autos mutual fund FSAVX (the CARZ ETF is unavailable through my broker). Positions now include:
FSAVX 3810.4 shares $189,300
MJFOX 12141.5 shares $185,522
IBB 1253.0 shares $228,885
Cash: $20,868
Portfolio, July 1, 2013
S&P 500: 1615 (114.9%)
Portfolio: $609,601 (121.9%)
IBB 1253 shares $223,647
IYZ 7150 shares $184,541
MJFOX 12,145.5 shares $180,544
Cash $20,868
Notes: The portfolio still holds IBB (Biotech), but sold IYT (Transportation) and ITB (Home Construction) for IYZ (Telecom) and MJFOX (Japan) at the beginning of May. None of the four funds are up over the past two months, but we were fortunate to move out of ITB (Home Construction) before its 12% two-month decline.
June 3 numbers were as follows:
S&P 500: 1640 (116.7%)
Portfolio: $606,815 (121.3%)
IBB 1253 shares $222,319
IYZ 7150 shares $187,401
MJFOX 12,145.5 shares $175,930
Cash $20,868

