
Portfolio, March 4, 2014
S&P 500: 1874 (133.4%)
Portfolio: $833,223 (166.6%)
IBB 1153 shares $310,041
VHT 2025 shares $223,659
PGJ 7750 shares $259,005
Cash $40,704
Notes: The portfolio has not made any changes this month, and has outperformed the S&P 500 by approximately double since beginning this blog. The S&P 500 strongly recovered from a minor correction in February, but the portfolio was positioned in three of the best-performing sectors of February and outperformed the S&P 500:

Portfolio, February 7, 2014
S&P 500: 1789 (127.3%)
Portfolio: $757,509 (151.5%)
IBB 1153 shares $281,435
VHT 2025 shares $208,312
PGJ 7750 shares $226,920
Cash $40,704
Notes: The portfolio sold IAI, the brokerage ETF, and bought VHT, the Vanguard Health Care ETF. Although the market in general was down for the year through February 7, the portfolio of growth sector mutual funds did not suffer the same fate:

Portfolio, January 10, 2014 (featuring a trade!)
S&P 500: 1842 (131.1%)
Portfolio: $771,287 (154.3%)
IBB 1153 shares $274,356
FSAVX sold
IAI 5675 shares $219,004
PGJ 7750 shares $237,522
Cash $40,405
Notes: The portfolio has made its first trade in months, as FSAVX has not performed as well as top funds/ETFs in recent months. The portfolio has done well even since the January 2 update, in large part due to its biotech stake.
Portfolio, January 1, 2014
S&P 500: 1832 (130.36%)
Portfolio: $751,762 (150.3%)
IBB 1153 shares $261,823
FSAVX 3820 shares $212,850
PGJ 7750 shares $236,607
Cash $40,480
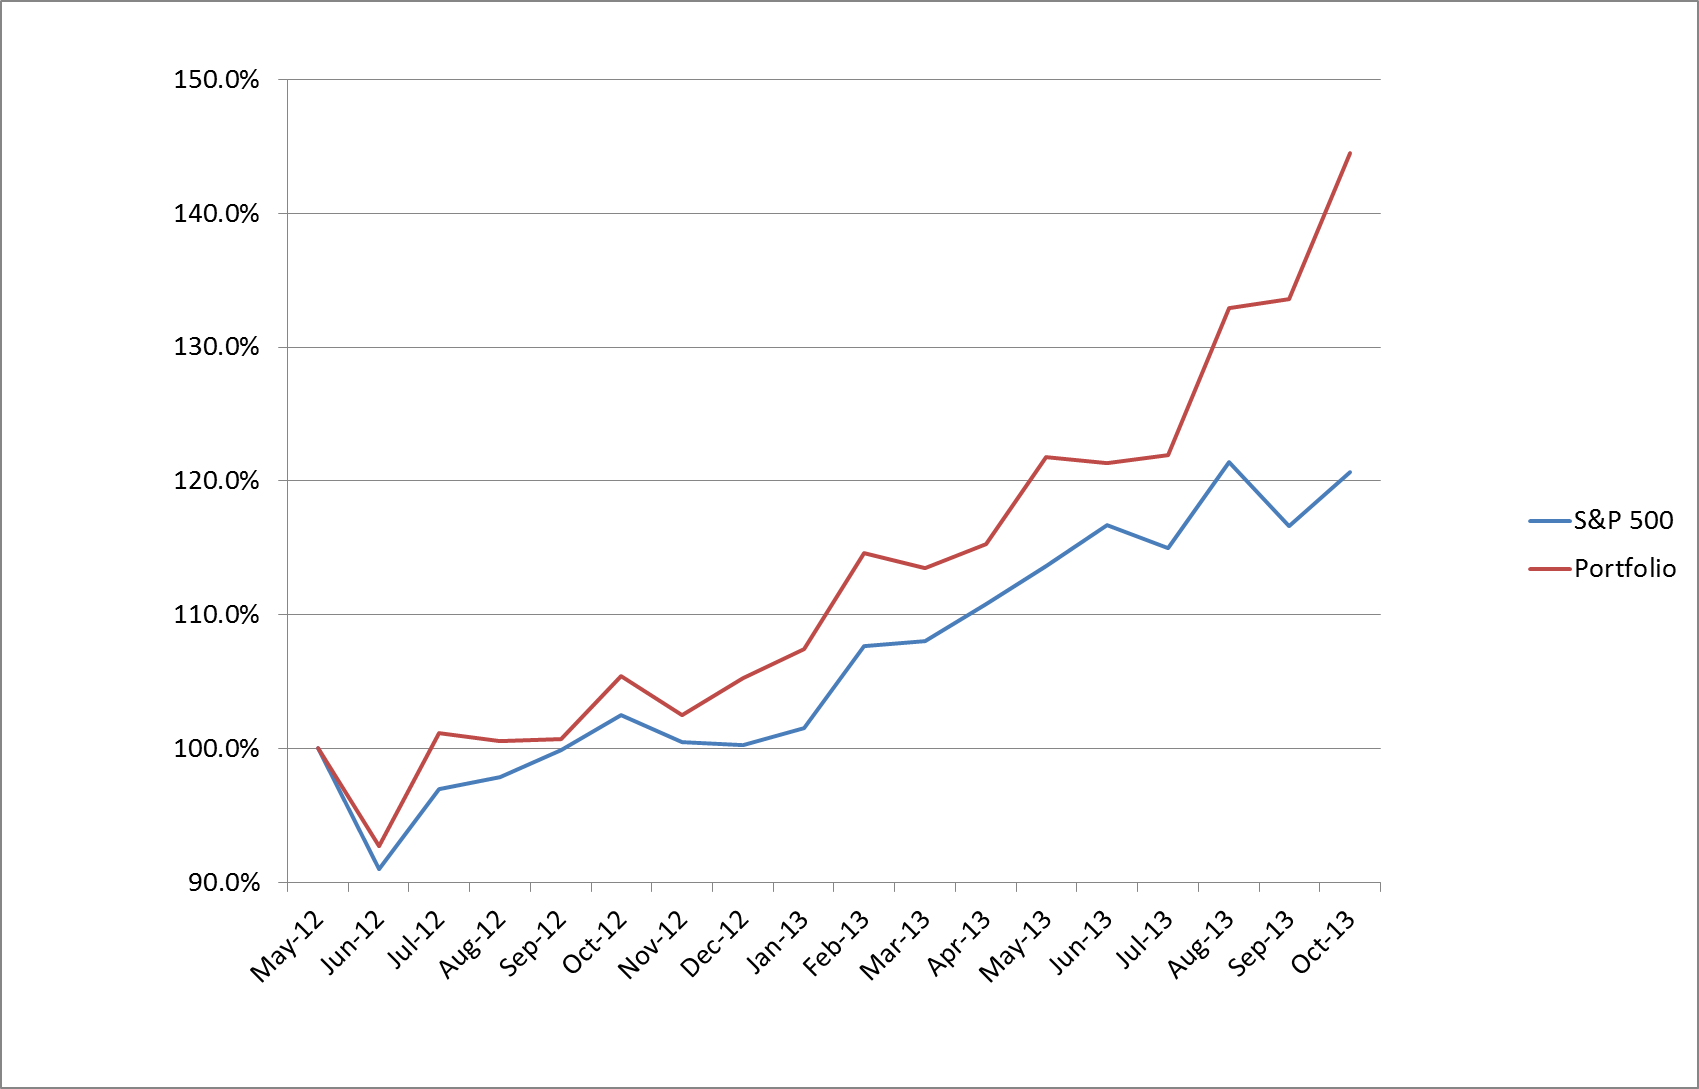
Notes: The portfolio has not made any changes since the October 1 update, and has outperformed the S&P 500 by 66% since beginning this blog. The portfolio lagged the S&P 500 in October, but outperformed in November and December, as reflected in the chart below:

Portfolio, October 1, 2013
S&P 500: 1695 (120.6%)
Portfolio: $722,613,601 (144.5%)
IBB 1153 shares $246,488
FSAVX 3820 shares $208,648
PGJ 7750 shares $226,997
Cash $40,480
Notes: The portfolio still holds IBB (Biotech), but now holds PGJ (China) and FSAVX (autos).
Trades
The portfolio sold its position in IYZ (Telecom) on Monday, July 8, and bought the Fidelity Autos mutual fund FSAVX (the CARZ ETF is unavailable through my broker). Positions now include:
FSAVX 3810.4 shares $189,300
MJFOX 12141.5 shares $185,522
IBB 1253.0 shares $228,885
Cash: $20,868
Portfolio, July 1, 2013
S&P 500: 1615 (114.9%)
Portfolio: $609,601 (121.9%)
IBB 1253 shares $223,647
IYZ 7150 shares $184,541
MJFOX 12,145.5 shares $180,544
Cash $20,868
Notes: The portfolio still holds IBB (Biotech), but sold IYT (Transportation) and ITB (Home Construction) for IYZ (Telecom) and MJFOX (Japan) at the beginning of May. None of the four funds are up over the past two months, but we were fortunate to move out of ITB (Home Construction) before its 12% two-month decline.
June 3 numbers were as follows:
S&P 500: 1640 (116.7%)
Portfolio: $606,815 (121.3%)
IBB 1253 shares $222,319
IYZ 7150 shares $187,401
MJFOX 12,145.5 shares $175,930
Cash $20,868

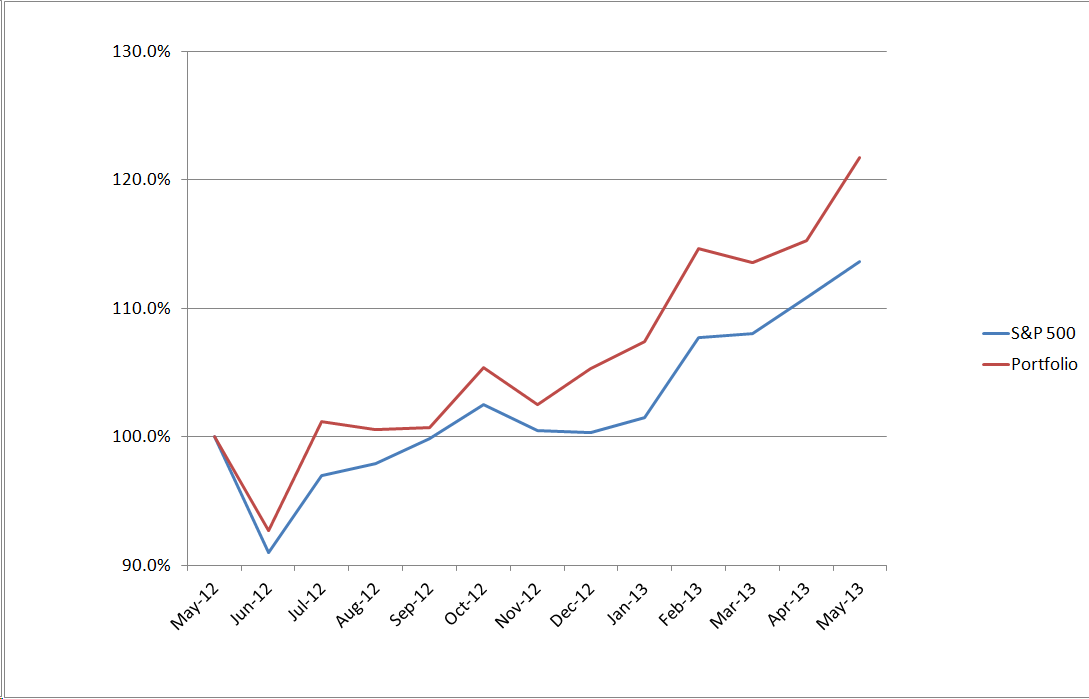
One Year Portfolio Checkup, May 1, 2013
S&P 500: 1597 (113.6%)
Portfolio: $608,800 (121.7%)
IBB 1253 shares $215,903
ITB 8160 shares $197,961
IYT 1585 shares $174,396
Cash $20,582
Notes: The portfolio has outperformed the S&P 500 over the past calendar year by 8.1%, and would have finished an additional 3% ahead of the S&P 500 if not out of the market due to a settlement/trading problem during a brief period last July.
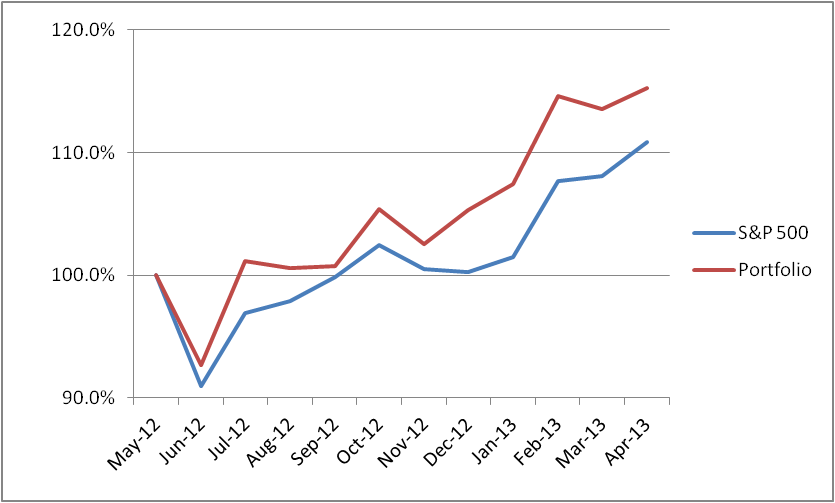
Portfolio, April 3, 2013
S&P 500: 1557 (110.8%)
Portfolio: $576,323 (115.3%)
IBB 1253 shares $200,166
ITB 8160 shares $183,110
IYT 1785 shares $190,959
Cash $582
Notes: The portfolio sold XLP, the consumer staples ETF that was bought last month as a defensive position, and bought IBB, a biotech ETF that has been performing well. XLP’s modest gains helped mitigate some losses incurred, as housing (ITB) is down slightly on the month.
Our portfolio is up 15.3 percent since May 1, 2012 compared with 10.8% for the S&P500. The portfolio briefly reached gains of 20% mid-month, while the S&P 500 reached a mid-month high of 1570, for a 11.7% gain since May 1, 2012.
Trade, March 4, 2013
Today the portfolio sold its stake in XBI, the Biotech ETF, and in XLE, the Energy ETF. It bought 1785 shares of IYT, a Transportation ETF, and 4990 shares of XLP, a Consumer Staples ETF. The portfolio now holds $952 in cash.
